Diagnostic Figures
Set print_figures: true in the configuration file to have DART-ID generate diagnostic figures for you. These figures are arranged in the figures.html file in the output folder.
Summary Figures
These figures give you a holistic look at how the DART-ID alignment went, and to what extend peptide IDs were upgraded/downgraded.
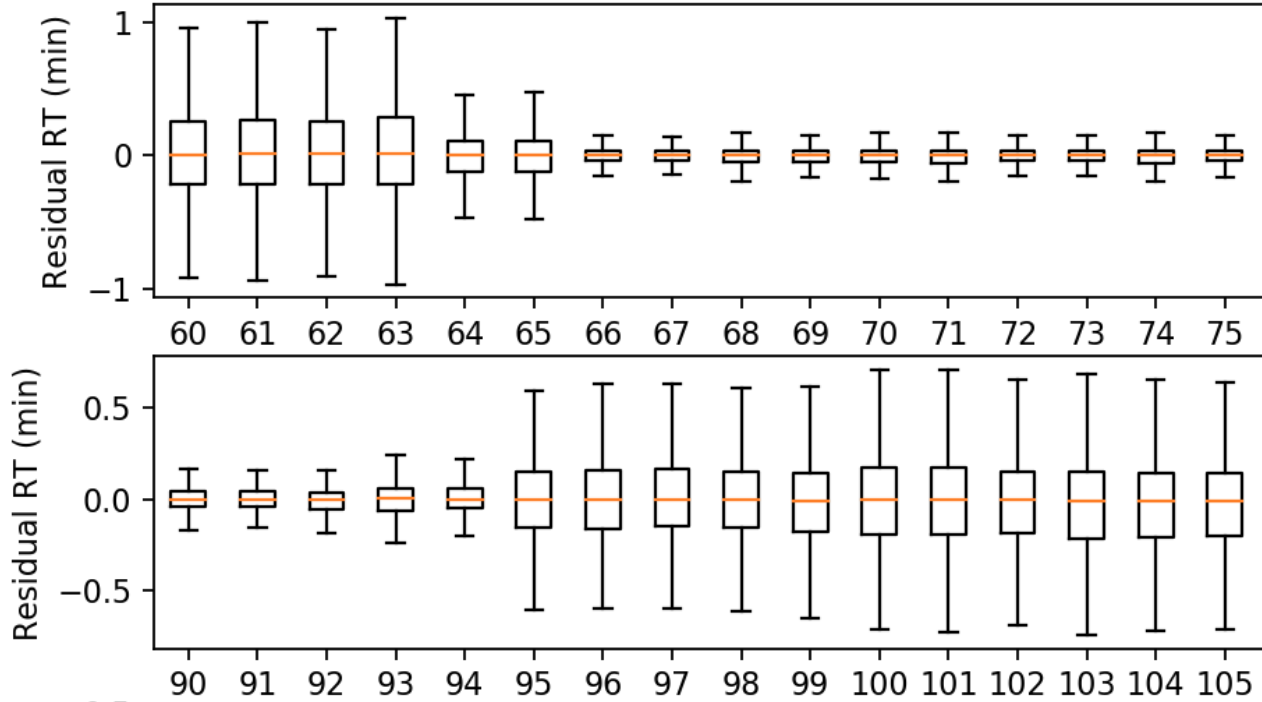
Residual Summary
A boxplot for each experiment aligned, where the values are the residual retention time: the absolute error between the observed RT and the inferred RT:
\[ \mbox{Residual RT} = \mbox{abs}(\mbox{Observed RT} - \mbox{Inferred RT}) \]
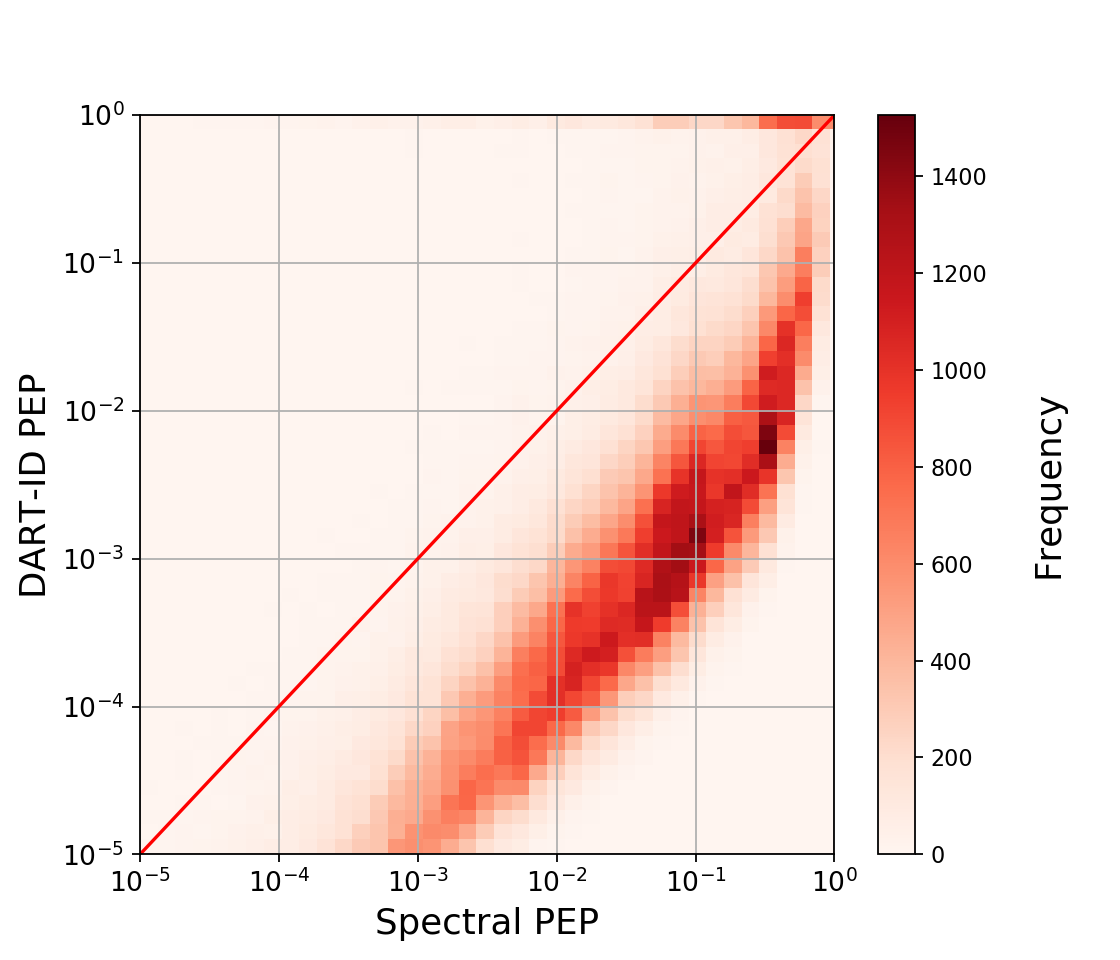
PEP Shifts
A 2D histogram showing the density in PEP shifts. Density below the 45° line represents upgraded PSMs, while density above the line represents downgraded PSMs. Distance from the 45° line represents the magnitude of the confidence shifts.
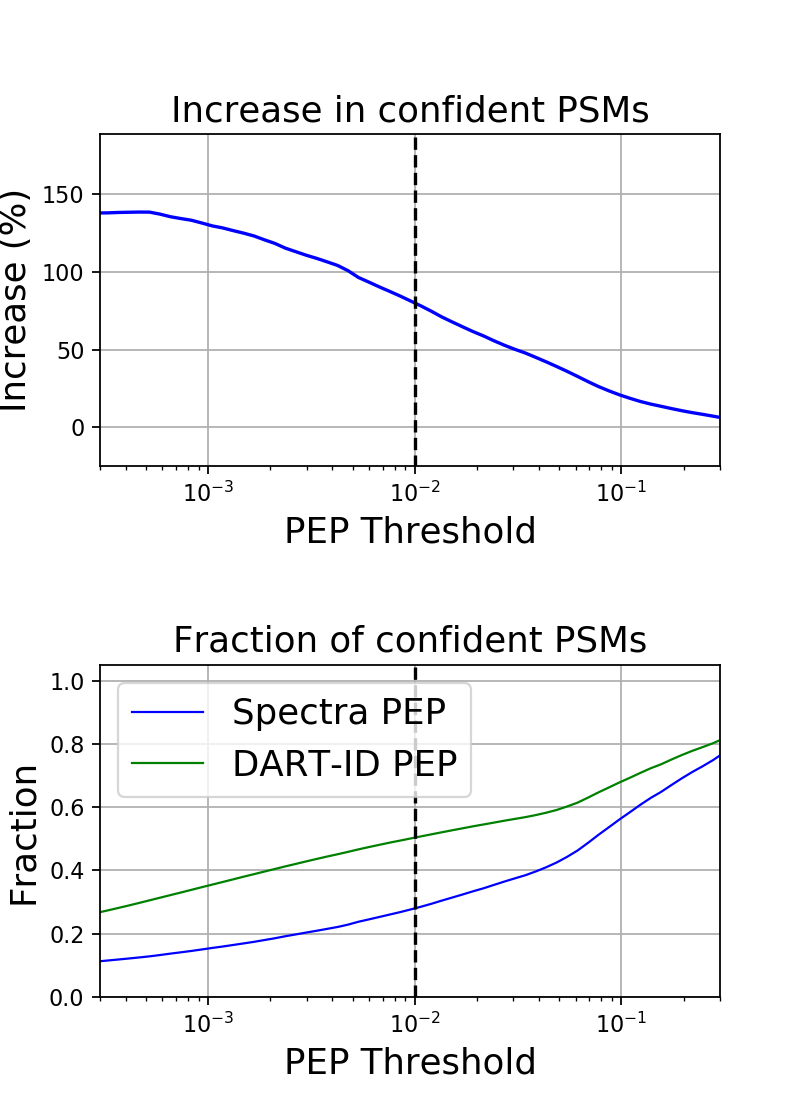
Increase in Confident PSMs
On the top, a line plot showing the percent increase in confident PSMs as a function of the confidence threshold. The dotted line at 0.01 is shown as a reference, i.e., the y-value of the line at PEP Threshold = 0.01 is the percent increase of PSMs when filtering PSMs at PEP < 0.01.
On the bottom, a line plot showing the fraction of PSMs selected when filtering at a PEP threshold, before and after applying DART-ID. A value of 0.5, for example, means that at a PEP threshold = 0.01, 50% of the peptides were selected at PEP < 0.01.
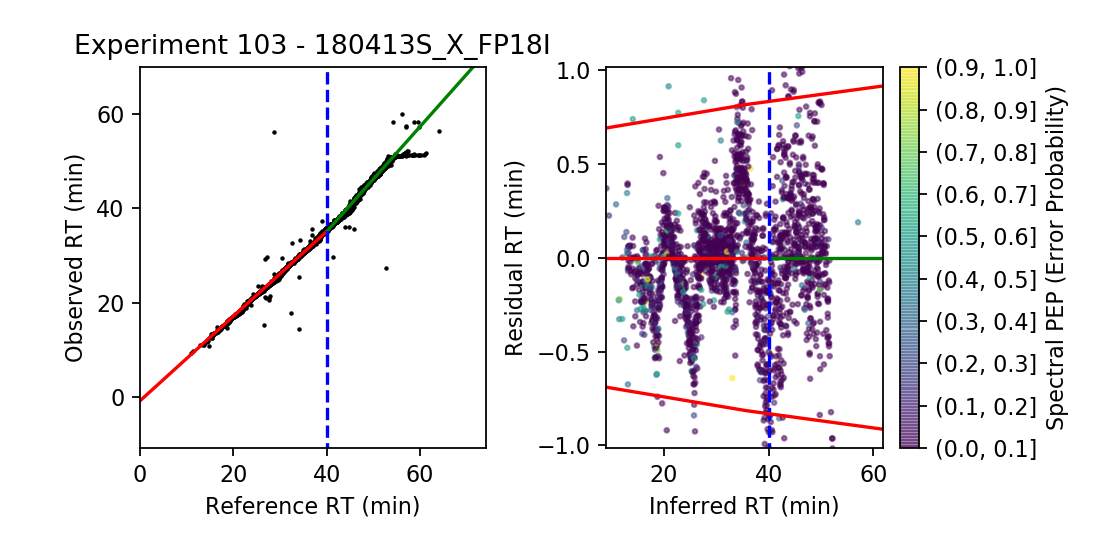
Experiment Summaries
Examine how the alignment performed for every experiment in the input data. This is particularly useful if you observe that an experiment from the residual boxplots has unusually high residual RTs.
The left plot shows for each peptide the observed RT versus the reference RT (\( \mu \)), with the experimental transforms overlaid (in this case, a two-segment regression).
The right plot shows the shifts in residual RT as a function of the inferred RT, where each peptide is also colored by its PEP (spectral error probability). The red lines denote the 2.5% and 97.5% percentile. The ranges of the experimental transform are also overlaid in the same colors.